College Factual began publishing its yearly rankings to help students identify graduate schools that put a high emphasis on educational quality as well as helping students succeed. These rankings are based on components such as post-graduation earnings of students, accumulated student debt of graduates, how much in demand the school is, and faculty and student diversity.
Bemidji State University landed the #778 spot in College Factual's 2024 Best Master's Degree Schools in the U.S. ranking out of a pool of 1149 colleges and universities that were eligible for this year's ranking.
In addition, Bemidji State University took the #20 spot for Best Master's Degree Schools in Minnesota.
The total graduate student population at Bemidji State University is made up of 62.6% women and 37.4% men. Note that these percentages may differ for certain degree programs.

Of all the graduate students at Bemidji State University, around 10.9% belong to a racial-ethnic minority group. Bemidji State University is popular with people from outside the United States, too. International students make up 1.0% of the graduate student population. The following chart shows the distribution of racial-ethnic groups at the school. If you click on it, you'll find more detailed information.

The average graduate full-time tuition and fees is shown in the table below.
| In-State | Out-of-State | |
|---|---|---|
| Tuition | $8,608 | $8,608 |
| Fees | $978 | $978 |
Graduate students earning a master's degree from Bemidji State University enter careers with an average starting salary of $53,489. That's about 8% lower than the countrywide average of $58,425 for all master's degree holders.

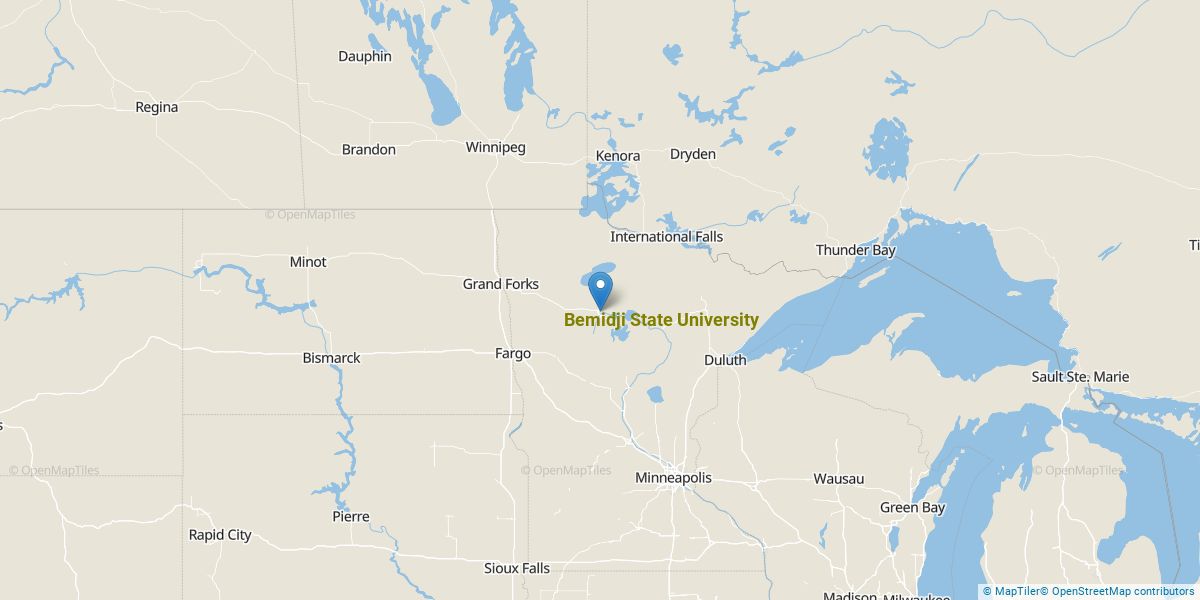
Get more details about the location of Bemidji State University.
Contact details for Bemidji State University are given below.
| Contact Details | |
|---|---|
| Address: | 1500 Birchmont Dr Ne, Bemidji, MN 56601 |
| Phone: | 800-475-2001 |
| Website: | https://www.bemidjistate.edu/ |
About 93.3% of the graduate students at Bemidji State University took at least one online class during the 2020-2021 academic year. Approximately 87.8% of grad students took all their classes online during that same time period.

The only degree programs listed here are those in which master’s degrees were awarded in 2020-2021.
| Master’s Degree Program | Annual Graduates |
|---|---|
| Business Administration & Management | 33 |
| General Biology | 5 |
| General Education | 19 |
| General English Literature | 7 |
| Natural Resources Conservation | 8 |
| Special Education | 25 |
| Teacher Education Subject Specific | 2 |
Footnotes
*The racial-ethnic minorities count is calculated by taking the total number of students and subtracting white students, international students, and students whose race/ethnicity was unknown. This number is then divided by the total number of students at the school to obtain the racial-ethnic minorities percentage.
References
More about our data sources and methodologies.