We’ve pulled together the essential facts you should know about the program at Baruch. Degrees are awarded at the Bachelor’s level. Its best result is a rank of #5 out of 15 schools (Bachelor’s level) by College Factual. Jump to any of the following sections:
College Factual rates Baruch as a strong choice for journalism, ranked #89 out of 203 schools nationally.
| Ranking | Rank |
|---|---|
| Best Journalism Schools | 89 of 203 |
| Best Journalism Schools in New York | 7 of 19 |
| Best Journalism Schools in the Middle Atlantic Region | 16 of 35 |
The table below lists every degree level offered in journalism at Baruch, along with how many graduates complete each level annually.
| Degree Level | Annual Graduates |
|---|---|
| Bachelor’s | 39 |
For the most recent IPEDS reporting year, CUNY Bernard M Baruch College handed out 39 bachelor’s degrees in journalism.
Baruch ranks competitively among schools offering journalism at the bachelor’s level. In particular it placed #5 out of 15 schools by College Factual.
| Ranking | Rank |
|---|---|
| Best Journalism Bachelor’s Degree Schools in New York | 5 |
| Best Journalism Bachelor’s Degree Schools in the Middle Atlantic Region | 13 |
| Best Journalism Bachelor’s Degree Schools | 83 |
Journalism students who finish a bachelor’s at Baruch go on to jobs where they make a median salary of $52,328 a year. This is below $85,257, the median for all majors at Baruch.
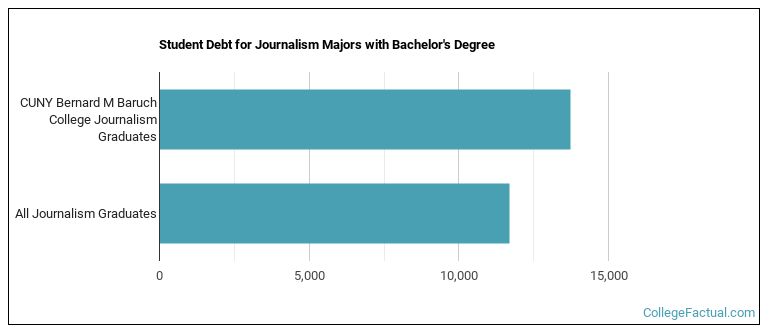
Earning a bachelor’s degree at Baruch, journalism students borrow a median amount of $13,717 in student loans. This is above $11,691, the typical median for all majors at Baruch.
Information about average full-time undergraduate tuition and fees is shown in the table below.
| In State | Out of State | |
|---|---|---|
| Tuition | $6,930 | $14,880 |
| Fees | $534 | $534 |
Find out more about Baruch tuition and fees.
In the most recent graduating class, 31% of journalism bachelor’s degrees went to men and 69% went to women.
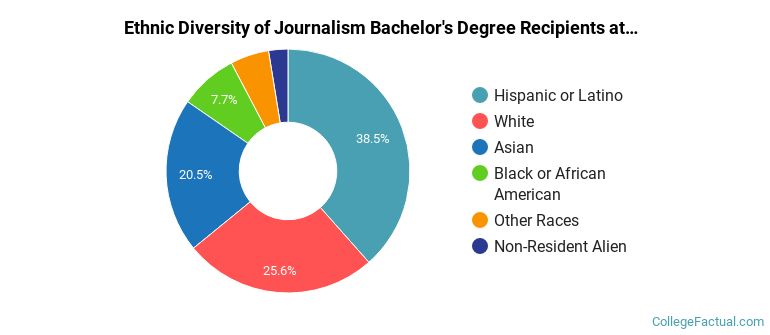
 The largest share of journalism bachelor’s degree graduates at Baruch are Hispanic or Latino. Roughly 38% of graduates fell into this category.
The following table and chart show the ethnic background for students who recently graduated from CUNY Bernard M Baruch College with a bachelor’s in journalism.
| Ethnic Background | Number of Students |
|---|---|
| Asian | 8 |
| Black or African American | 3 |
| Hispanic or Latino | 15 |
| White | 10 |
| Non-Resident Aliens | 1 |
| Other Races | 2 |
