College Factual recognizes the best colleges and universities in its annual rankings. These rankings include categories for best overall colleges, best colleges for each major, best value schools, and much more.
Emporia State University was awarded 27 badges in the 2025 rankings. The highest ranked major at the school is teacher education subject specific.
Explore the best ranked schools for the programs you are most interested in.
According to College Factual's 2025 analysis, ESU is ranked #1,032 out of 2,152 schools in the nation that were analyzed for overall quality.
ESU also holds the #11 spot on the Best Colleges in Kansas ranking.
With an acceptance rate of 96%, ESU has a fairly liberal admissions policy. However, don't just assume you'll get in! Put together a good application and make sure you include all requested documents and materials.
ESU received ACT scores from 36% of accepted students. When looking at the 25th through the 75th percentile, ACT Composite scores ranged between 16 and 24.
The student to faculty ratio at Emporia State University is about average at 17 to 1. This ratio is often used to gauge how many students might be in an average class and how much time professors will have to spend with their students on an individual level. The national average for this metric is 15 to 1.
In addition to the student to faculty ratio, some people look at what percentage of faculty members are full-time as a sign of how much time professors will be able to spend with their students. This is because part-time teachers may not be be on campus as much as their full-time counterparts.
The full-time faculty percentage at Emporia State University is 91%. This is higher than the national average of 47%.
The freshmen retention rate tells us what percentage of first-year, full-time students choose to continue on to their sophomore year at a particular school. The rate at Emporia State University is 72%, which is about average when compared to the national rate of 68%.
The on-time graduation rate is the percent of first-time, full time students who obtain their bachelor's degree in four years or less. This rate is 27% for first-time, full-time students at ESU, which is lower than the national rate of 33.3%.
Find out more about the retention and graduation rates at Emporia State University.
During the 2017-2018 academic year, there were 3,181 undergraduates at ESU with 2,909 being full-time and 272 being part-time.
| $0-30 K | $30K-48K | $48-75 | $75-110K | $110K + |
|---|---|---|---|---|
| $10,908 | $11,563 | $14,224 | $17,265 | $16,763 |
The net price is calculated by adding tuition, room, board and other costs and subtracting financial aid.Note that the net price is typically less than the published for a school. For more information on the sticker price of ESU, see our tuition and fees and room and board pages.
Almost 66% of college students who graduated with the class of 2018 took out student loans, but that percentage varies from school to school. At ESU, approximately 73% of students took out student loans averaging $6,821 a year. That adds up to $27,284 over four years for those students.
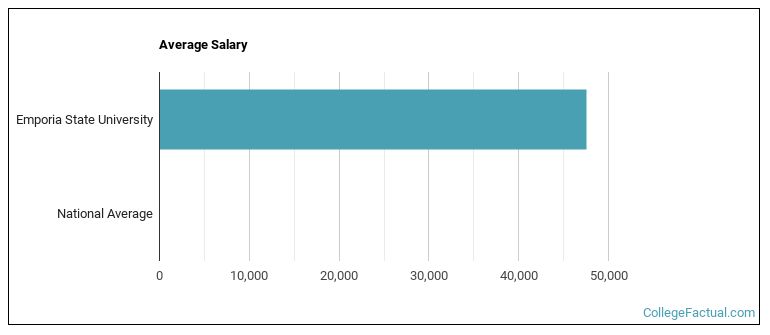
See which majors at Emporia State University make the most money.
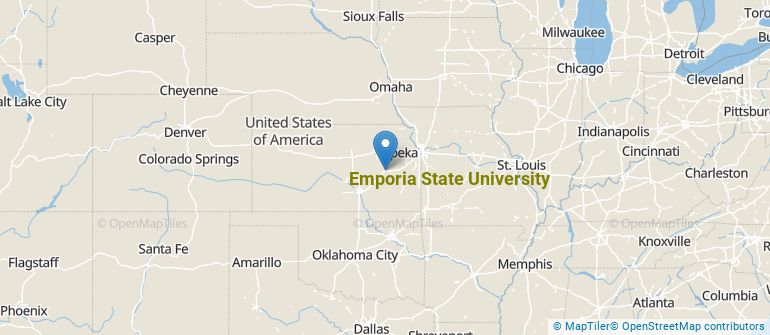
Get more details about the location of Emporia State University.
Contact details for ESU are given below.
| Contact Details | |
|---|---|
| Address: | 1 Kellogg Circle, Emporia, KS 66801-5415 |
| Phone: | 620-341-1200 |
| Website: | www.emporia.edu/ |
| Most Popular Majors | Bachelor’s Degrees | Average Salary of Graduates |
|---|---|---|
| Curriculum & Instruction | 241 | NA |
| Teacher Education Grade Specific | 209 | $43,933 |
| Business Administration & Management | 207 | $40,528 |
| Library & Information Science | 181 | NA |
| Educational Administration | 170 | NA |
| Teacher Education Subject Specific | 167 | $43,954 |
| Accounting | 99 | $40,967 |
| Nursing | 86 | $60,066 |
| Special Education | 67 | NA |
| General Psychology | 57 | $35,389 |
Online learning options are becoming more and more popular at American colleges and universities. Online classes are great for students who have busy schedules or for those who just want to study on their own time.
In 2022-2023, 3,954 students took at least one online class at Emporia State University. This is an increase from the 3,937 students who took online classes the previous year.
| Year | Took at Least One Online Class | Took All Classes Online |
|---|---|---|
| 2022-2023 | 3,954 | 2,520 |
| 2021-2022 | 3,937 | 2,639 |
| 2020-2021 | 3,826 | 2,511 |
| 2018-2019 | 3,164 | 1,995 |
Learn more about online learning at Emporia State University.
Footnotes
*The racial-ethnic minorities count is calculated by taking the total number of students and subtracting white students, international students, and students whose race/ethnicity was unknown. This number is then divided by the total number of students at the school to obtain the racial-ethnic minorities percentage.
References
More about our data sources and methodologies.