Jump to any of the following sections:
The bachelor's program at Purdue University Global was ranked #989 on College Factual's Best Schools for education list. It is also ranked #27 in Indiana.
| Ranking Type | Rank |
|---|---|
| 19 | |
| 97 | |
| Best Value Associate Degree Colleges for Education | 159 |
| Best Education Associate Degree Schools | 179 |
| 199 | |
| 205 | |
| Best Value Bachelor’s Degree Colleges for Education | 269 |
| Best Value Master’s Degree Colleges for Education | 396 |
| 533 | |
| 715 | |
| Best Education Bachelor’s Degree Schools | 800 |
| Best Education Master’s Degree Schools | 809 |
| 994 | |
| 1,164 |
During the 2020-2021 academic year, Purdue University Global handed out 130 bachelor's degrees in education. Due to this, the school was ranked #222 in popularity out of all colleges and universities that offer this degree. This is a decrease of 12% over the previous year when 148 degrees were handed out.
In 2021, 202 students received their master’s degree in education from Purdue University Global. This makes it the #200 most popular school for education master’s degree candidates in the country.
Take a look at the following statistics related to the make-up of the education majors at Purdue University Global.
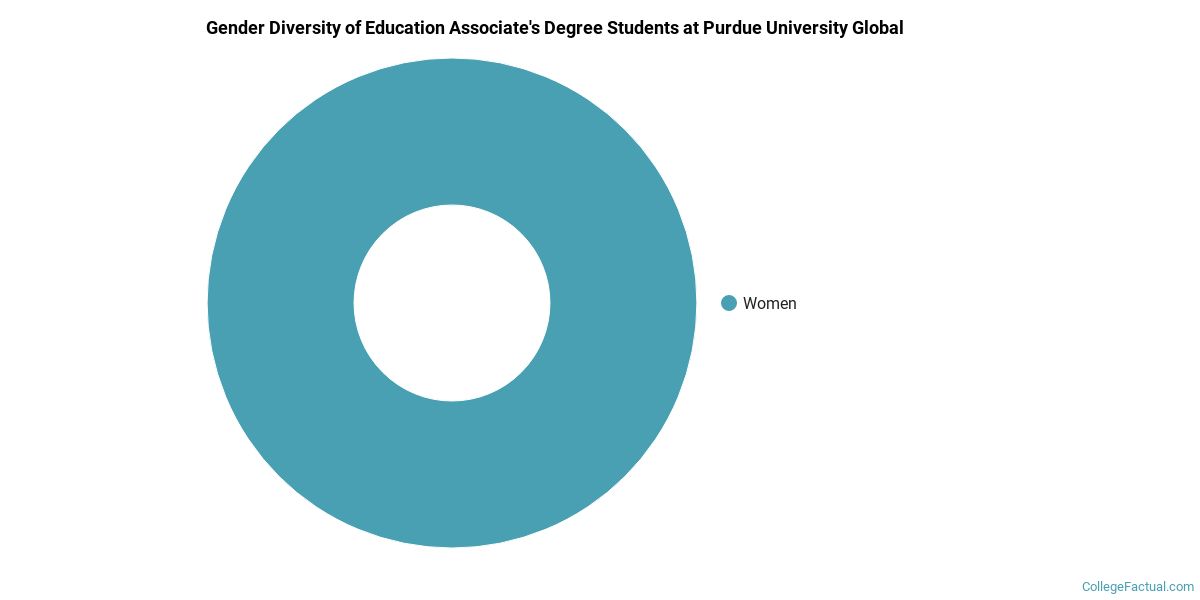
All of the 5 students who graduated with a Associate’s in education from Purdue University Global in 2021 were women.
The majority of associate's degree recipients in this major at Purdue University Global are white. In the most recent graduating class for which data is available, 60% of students fell into this category.
The following table and chart show the ethnic background for students who recently graduated from Purdue University Global with a associate's in education.

| Ethnic Background | Number of Students |
|---|---|
| Asian | 0 |
| Black or African American | 2 |
| Hispanic or Latino | 0 |
| White | 3 |
| Non-Resident Aliens | 0 |
| Other Races | 0 |
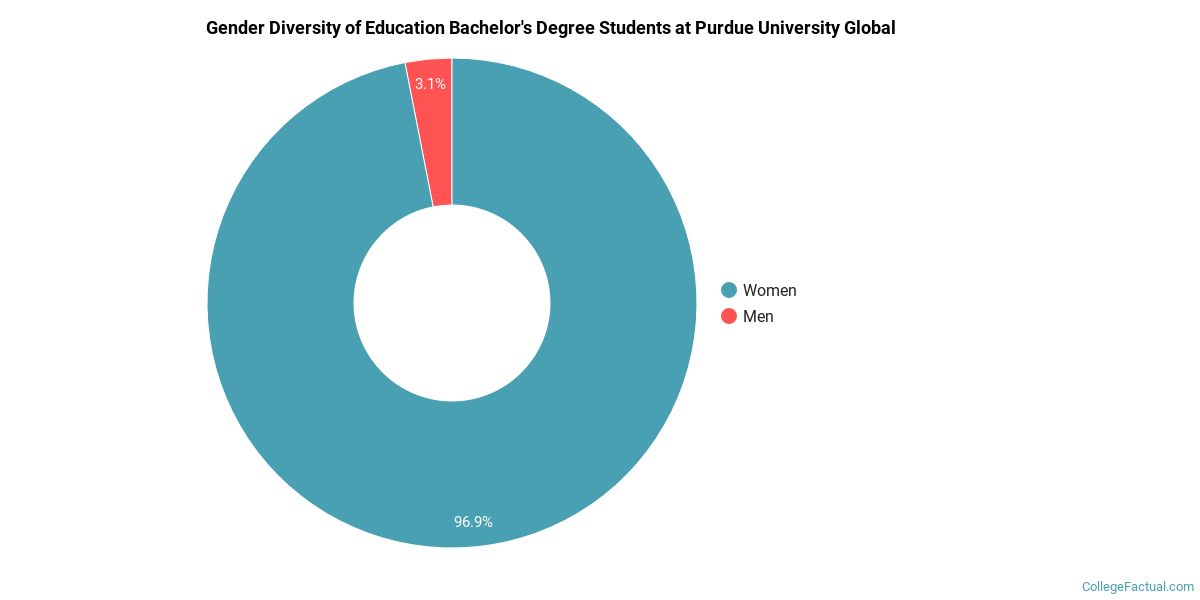
For the most recent academic year available, 3% of education bachelor's degrees went to men and 97% went to women.
The following table and chart show the ethnic background for students who recently graduated from Purdue University Global with a bachelor's in education.
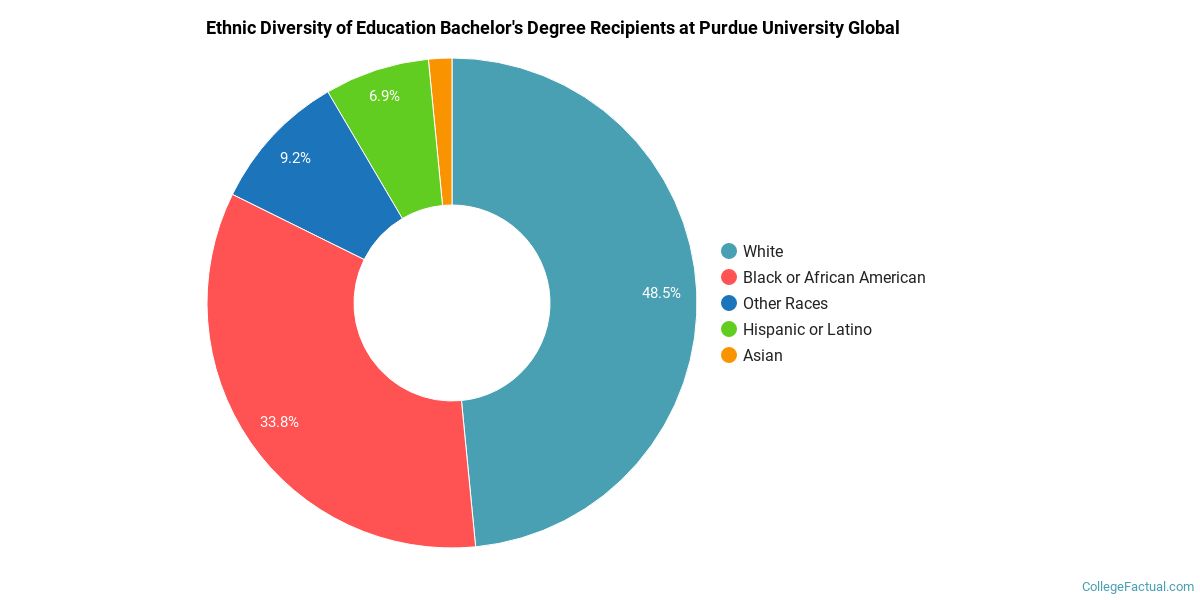
| Ethnic Background | Number of Students |
|---|---|
| Asian | 2 |
| Black or African American | 44 |
| Hispanic or Latino | 9 |
| White | 63 |
| Non-Resident Aliens | 0 |
| Other Races | 12 |
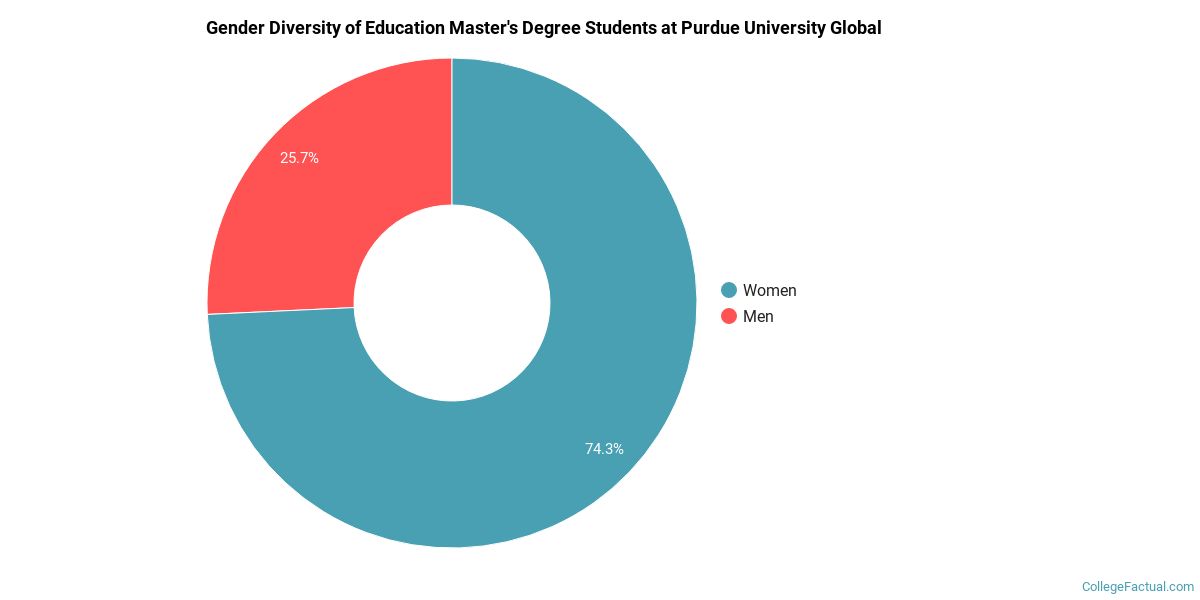
The education program at Purdue University Global awarded 202 master's degrees in 2020-2021. About 26% of these degrees went to men with the other 74% going to women.
The majority of the students with this major are white. About 59% of 2021 graduates were in this category.
The following table and chart show the ethnic background for students who recently graduated from Purdue University Global with a master's in education.

| Ethnic Background | Number of Students |
|---|---|
| Asian | 6 |
| Black or African American | 44 |
| Hispanic or Latino | 18 |
| White | 120 |
| Non-Resident Aliens | 0 |
| Other Races | 14 |
Education students may decide to major in one of the following focus areas. Individual majors may not be available for all degree levels.
| Major | Annual Graduates |
|---|---|
| Educational Administration | 239 |
| Instructional Media Design | 74 |
| Teacher Education Grade Specific | 59 |
| Related Major | Annual Graduates |
|---|---|
| Psychology | 431 |
| Communication & Journalism | 127 |
| Social Sciences | 104 |
View All Education Related Majors >
More about our data sources and methodologies.