Explore the best ranked schools for the programs you are most interested in.
Marietta was not ranked in College Factual's Best Overall Colleges report this year. This may be because not enough data was available.
The acceptance rate at Marietta College is 83%. That's higher than the rate at many schools, but still low enough to be considered somewhat selective. If you want to get in, you'll need good grades and to be able to show that Marietta is a good fit for you.
About 19% of students accepted to Marietta submitted their SAT scores. When looking at the 25th through the 75th percentile, SAT Evidence-Based Reading and Writing scores ranged between 480 and 580. Math scores were between 460 and 550.
At Marietta, the student to faculty ratio is an excellent 9 to 1. That's much better than the national average of 15 to 1. This indicates that many classes will probably be small, and students will have ample opportunites to work closely with their professors and classmates.
Another measure that is often used to estimate how much access students will have to their professors is how many faculty members are full-time. The idea here is that part-time faculty tend to spend less time on campus, so they may not be as available to students as full-timers.
The full-time faculty percentage at Marietta College is 100%. This is higher than the national average of 47%.
The freshmen retention rate tells us what percentage of first-year, full-time students choose to continue on to their sophomore year at a particular school. The rate at Marietta College is 64%, which is about average when compared to the national rate of 68%.
The on-time graduation rate for someone pursuing a bachelor's degree is typically four years. This rate at Marietta for first-time, full-time students is 50%, which is better than the national average of 33.3%.
Find out more about the retention and graduation rates at Marietta College.
During the 2017-2018 academic year, there were 1,168 undergraduates at Marietta with 1,110 being full-time and 58 being part-time.
| $0-30 K | $30K-48K | $48-75 | $75-110K | $110K + |
|---|---|---|---|---|
| $16,908 | $15,010 | $18,258 | $20,750 | $26,798 |
The net price is calculated by adding tuition, room, board and other costs and subtracting financial aid.Note that the net price is typically less than the published for a school. For more information on the sticker price of Marietta, see our tuition and fees and room and board pages.
It's not uncommon for college students to take out loans to pay for school. In fact, almost 66% of students nationwide depend at least partially on loans. At Marietta, approximately 61% of students took out student loans averaging $8,427 a year. That adds up to $33,708 over four years for those students.
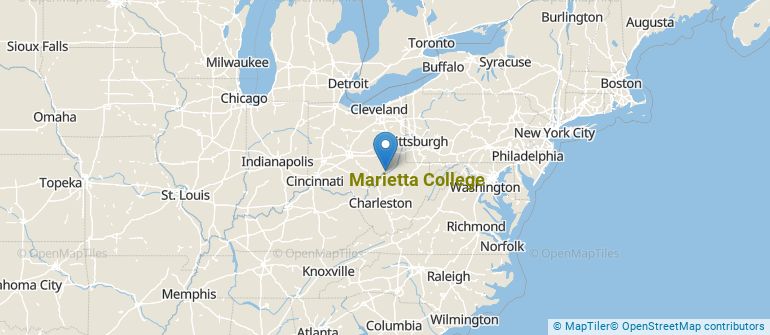
Get more details about the location of Marietta College.
Contact details for Marietta are given below.
| Contact Details | |
|---|---|
| Address: | Irvine Bldg, Marietta, OH 45750 |
| Phone: | 800-331-7896 |
| Website: | https://www.marietta.edu/ |
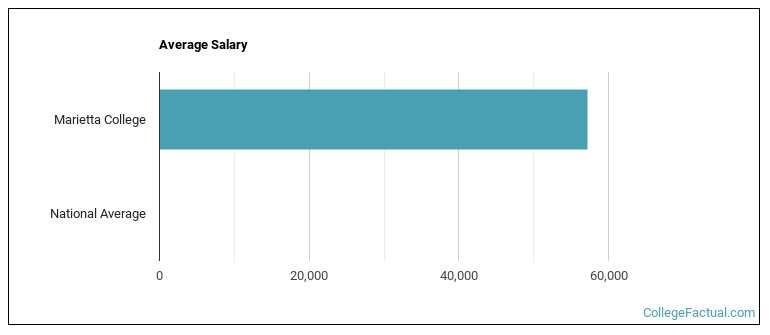
| Most Popular Majors | Bachelor’s Degrees | Average Salary of Graduates |
|---|---|---|
| Allied Health Professions | 37 | NA |
| Petroleum Engineering | 35 | $82,205 |
| Marketing | 23 | $44,959 |
| Business Administration & Management | 20 | NA |
| Political Science & Government | 17 | NA |
| General Psychology | 15 | NA |
| Health & Physical Education | 14 | NA |
| General Biology | 12 | NA |
| Special Education | 12 | NA |
| Finance & Financial Management | 10 | NA |
Online learning is becoming popular at even the oldest colleges and universities in the United States. Not only are online classes great for returning adults with busy schedules, they are also frequented by a growing number of traditional students.
In 2022-2023, 82 students took at least one online class at Marietta College. This is an increase from the 0 students who took online classes the previous year.
| Year | Took at Least One Online Class | Took All Classes Online |
|---|---|---|
| 2022-2023 | 82 | 10 |
| 2021-2022 | 0 | 0 |
| 2020-2021 | 0 | 0 |
| 2018-2019 | 0 | 0 |
If you’re considering Marietta College, here are some more schools you may be interested in knowing more about.
Curious on how these schools stack up against Marietta? Pit them head to head with College Combat, our free interactive tool that lets you compare college on the features that matter most to you!
Footnotes
*The racial-ethnic minorities count is calculated by taking the total number of students and subtracting white students, international students, and students whose race/ethnicity was unknown. This number is then divided by the total number of students at the school to obtain the racial-ethnic minorities percentage.
References
More about our data sources and methodologies.