In its yearly rankings, College Factual analyzes over 2,000 colleges and universities to determine which ones are the best in a variety of categories, such as overall value, quality, diversity, which schools are the best for each major, and much more.
Vermont Technical College was awarded 10 badges in the 2025 rankings. The highest ranked major at the school is nursing.
Explore the best ranked schools for the programs you are most interested in.
Vermont Tech landed the #962 spot in College Factual's 2025 ranking of best overall colleges in the United States. The higher ed experts analyzed 2,152 colleges and universities across the nation to determine this ranking. This is an improvement over the previous year, when Vermont Tech held the #1,316 spot on the Best Overall Colleges list.
Vermont Tech also holds the #6 spot on the Best Colleges in Vermont ranking.
If you're applying to Vermont Technical College you'll face some tough competition, since the school's acceptance rate is only 50%. Definitely don't wait until the last minute to submit your application, since applying early may be in your favor.
At Vermont Tech, the student to faculty ratio is an excellent 10 to 1. That's much better than the national average of 15 to 1. This indicates that many classes will probably be small, and students will have ample opportunites to work closely with their professors and classmates.
When estimating how much access students will have to their teachers, some people like to look at what percentage of faculty members are full time. This is because part-time teachers may not have as much time to spend on campus as their full-time counterparts.
The full-time faculty percentage at Vermont Technical College is 100%. This is higher than the national average of 47%.
The freshmen retention rate tells us what percentage of first-year, full-time students choose to continue on to their sophomore year at a particular school. The rate at Vermont Technical College is 67%, which is about average when compared to the national rate of 68%.
The on-time graduation rate is the percent of first-time, full time students who obtain their bachelor's degree in four years or less. This rate is 24% for first-time, full-time students at Vermont Tech, which is lower than the national rate of 33.3%.
Find out more about the retention and graduation rates at Vermont Technical College.
During the 2017-2018 academic year, there were 1,516 undergraduates at Vermont Tech with 829 being full-time and 687 being part-time.
| $0-30 K | $30K-48K | $48-75 | $75-110K | $110K + |
|---|---|---|---|---|
| $13,931 | $15,670 | $17,742 | $20,475 | $24,474 |
The net price is calculated by adding tuition, room, board and other costs and subtracting financial aid.Note that the net price is typically less than the published for a school. For more information on the sticker price of Vermont Tech, see our tuition and fees and room and board pages.
While almost two-thirds of students nationwide take out loans to pay for college, the percentage may be quite different for the school you plan on attending. At Vermont Tech, approximately 72% of students took out student loans averaging $10,622 a year. That adds up to $42,488 over four years for those students.
Get more details about paying for Vermont Technical College.
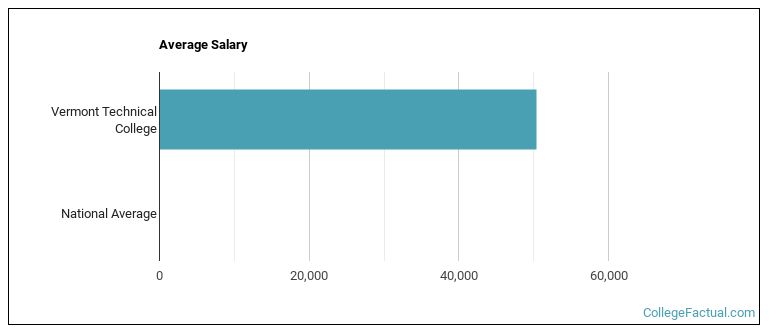
See which majors at Vermont Technical College make the most money.
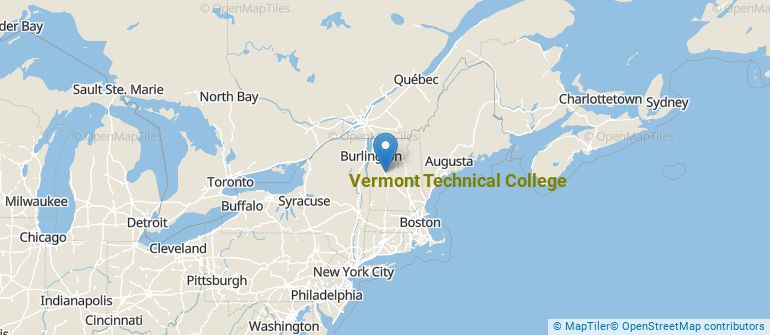
Get more details about the location of Vermont Technical College.
Contact details for Vermont Tech are given below.
| Contact Details | |
|---|---|
| Address: | 124 Admin Drive, Randolph, VT 05061 |
| Phone: | 802-224-3000 |
| Website: | vermontstate.edu/ |
| Most Popular Majors | Bachelor’s Degrees | Average Salary of Graduates |
|---|---|---|
| Nursing | 170 | $75,160 |
| Practical Nursing & Nursing Assistants | 142 | NA |
| Allied Health Professions | 39 | NA |
| Business Administration & Management | 28 | $37,469 |
| Dental Support Services | 24 | NA |
| Computer Engineering | 19 | NA |
| Veterinary/Animal Health Technologies/Technicians | 16 | NA |
| Architectural Engineering Technology | 14 | NA |
| Construction Management | 13 | NA |
| Electronics Engineering Technology | 12 | NA |
Online courses area a great option for busy, working students as well as for those who have scheduling conflicts and want to study on their own time. As time goes by, expect to see more and more online learning options become available.
In 2022-2023, 681 students took at least one online class at Vermont Technical College. This is an increase from the 593 students who took online classes the previous year.
| Year | Took at Least One Online Class | Took All Classes Online |
|---|---|---|
| 2022-2023 | 681 | 231 |
| 2021-2022 | 593 | 205 |
| 2020-2021 | 634 | 113 |
| 2018-2019 | 398 | 145 |
Learn more about online learning at Vermont Technical College.
If you’re considering Vermont Technical College, here are some more schools you may be interested in knowing more about.
Curious on how these schools stack up against Vermont Tech? Pit them head to head with College Combat, our free interactive tool that lets you compare college on the features that matter most to you!
Footnotes
*The racial-ethnic minorities count is calculated by taking the total number of students and subtracting white students, international students, and students whose race/ethnicity was unknown. This number is then divided by the total number of students at the school to obtain the racial-ethnic minorities percentage.
References
More about our data sources and methodologies.