The total graduate student population at Guilford is made up of 88.9% women and 11.1% men. Note that these percentages may differ for certain degree programs.

About 44.4% of the graduate students who attend Guilford are from a racial-ethnic minority group*. For more details on graduate school diversity at the school, check out the chart below. If you click on it, you'll be taken to a page with more details.

The average tuition and fees for graduate students is shown below.
| In-State | Out-of-State | |
|---|---|---|
| Tuition | $5,400 | $5,400 |
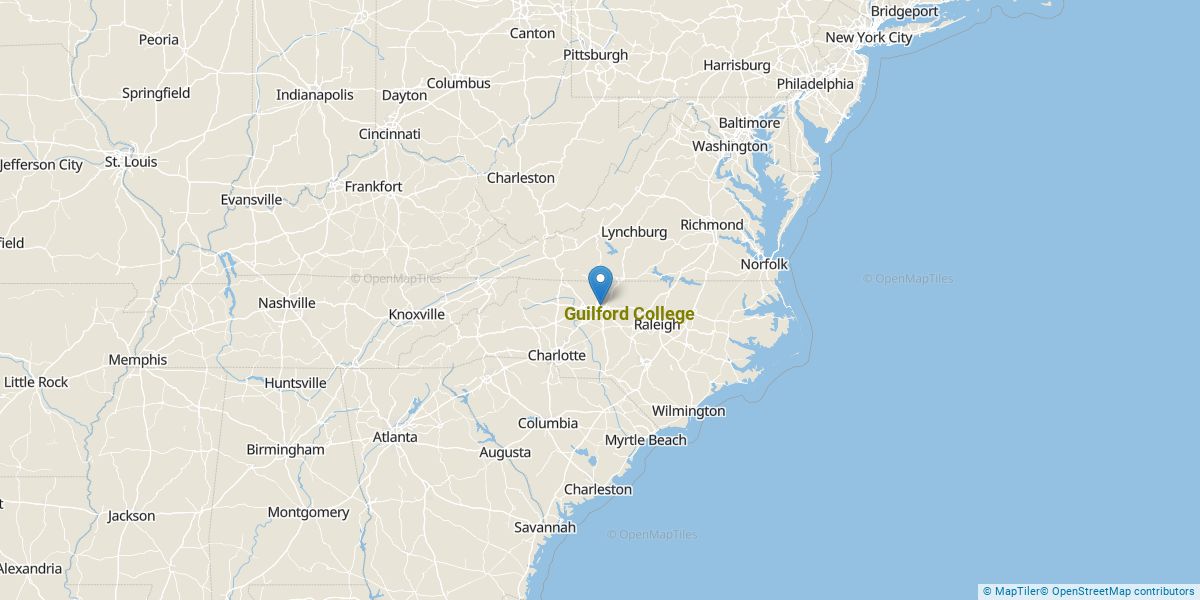
Get more details about the location of Guilford College.
Contact details for Guilford are given below.
| Contact Details | |
|---|---|
| Address: | 5800 W Friendly Avenue, Greensboro, NC 27410-4108 |
| Phone: | 336-316-2000 |
| Website: | https://www.guilford.edu/ |
| Facebook: | https://www.facebook.com/guilfordcollege |
| Twitter: | https://twitter.com/GuilfordCollege |
The only degree programs listed here are those in which master’s degrees were awarded in 2020-2021.
| Master’s Degree Program | Annual Graduates |
|---|---|
| Criminal Justice & Corrections | 2 |
Footnotes
*The racial-ethnic minorities count is calculated by taking the total number of students and subtracting white students, international students, and students whose race/ethnicity was unknown. This number is then divided by the total number of students at the school to obtain the racial-ethnic minorities percentage.
References
More about our data sources and methodologies.