Here, you'll find out more about the major, including such details as the number of graduates, what degree levels are offered, ethnicity of students, average salaries, and more. In addition, we cover how ESU ranks in comparison to other schools with subject specific ed programs.
Go directly to any of the following sections:
ESU was ranked #66 on College Factual's most recent list of the best schools for subject specific ed majors. This puts the bachelor's program at the school solidly in the top 15% of all colleges and universities in the country. It is also ranked #1 in Kansas.
During the 2021-2022 academic year, Emporia State University handed out 76 bachelor's degrees in teacher education subject specific. This is an increase of 9% over the previous year when 70 degrees were handed out.
In 2022, 70 students received their master’s degree in subject specific ed from ESU. This makes it the #50 most popular school for subject specific ed master’s degree candidates in the country.
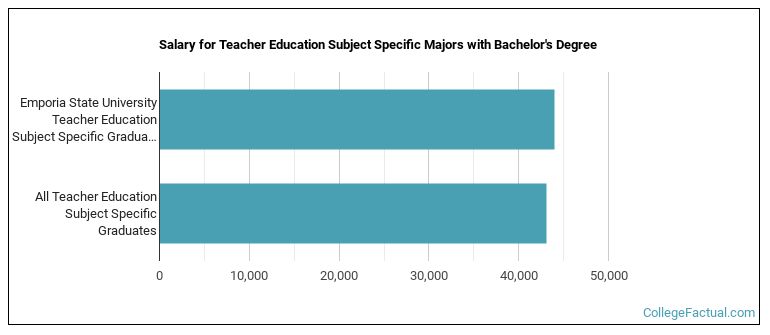
The median salary of subject specific ed students who receive their bachelor's degree at ESU is $43,954. This is higher than $43,086, which is the national median for all subject specific ed bachelor's degree recipients.
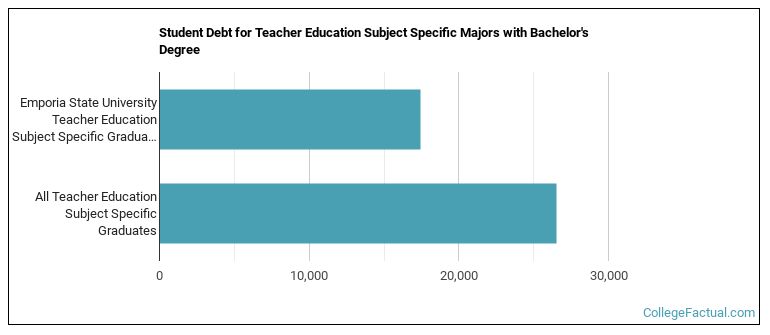
While getting their bachelor's degree at ESU, subject specific ed students borrow a median amount of $17,470 in student loans. This is not too bad considering that the median debt load of all subject specific ed bachelor's degree recipients across the country is $26,530.
The typical student loan payment of a bachelor's degree student from the subject specific ed program at ESU is $179 per month.
During the 2022-2023 academic year, part-time undergraduate students at ESU paid an average of $462 per credit hour if they came to the school from out-of-state. In-state students paid a discounted rate of $185 per credit hour. Information about average full-time undergraduate tuition and fees is shown in the table below.
| In State | Out of State | |
|---|---|---|
| Tuition | $5,542 | $13,855 |
| Fees | $1,814 | $1,814 |
| Books and Supplies | $1,160 | $1,160 |
| On Campus Room and Board | $10,542 | $10,542 |
| On Campus Other Expenses | $4,248 | $4,248 |
Learn more about ESU tuition and fees.
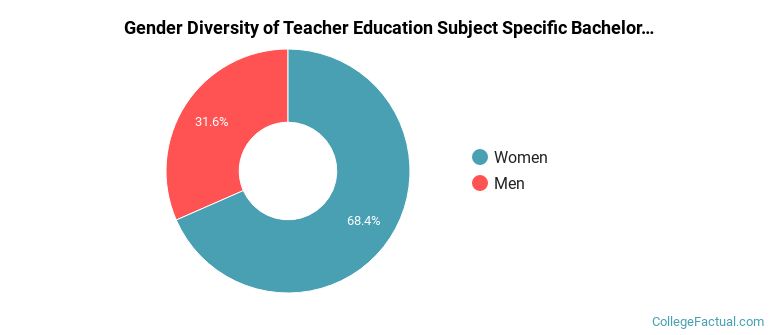
During the 2021-2022 academic year, 76 subject specific ed majors earned their bachelor's degree from ESU. Of these graduates, 32% were men and 68% were women.
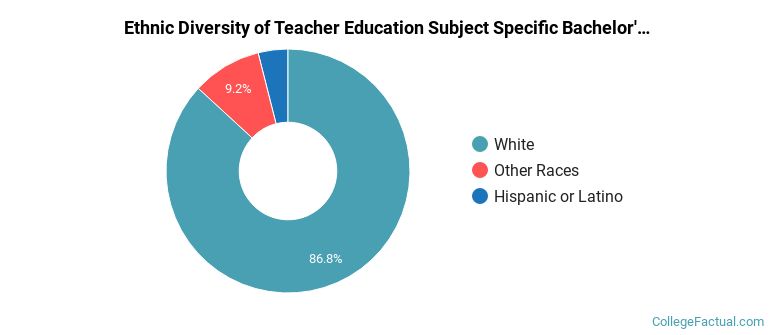
The majority of bachelor's degree recipients in this major at ESU are white. In the most recent graduating class for which data is available, 87% of students fell into this category.
The following table and chart show the ethnic background for students who recently graduated from Emporia State University with a bachelor's in subject specific ed.
| Ethnic Background | Number of Students |
|---|---|
| Asian | 0 |
| Black or African American | 0 |
| Hispanic or Latino | 3 |
| White | 66 |
| Non-Resident Aliens | 0 |
| Other Races | 7 |
ESU does not offer an online option for its subject specific ed bachelor’s degree program at this time. To see if the school offers distance learning options in other areas, visit the ESU Online Learning page.
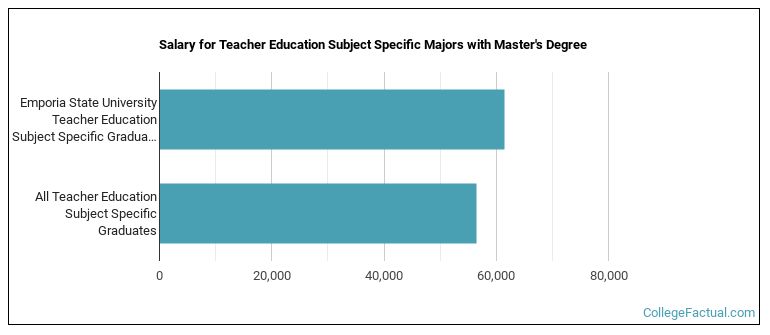
Subject Specific Ed majors graduating with a master's degree from ESU make a median salary of $61,434 a year. This is a better than average outcome since the median salary for all subject specific ed graduates with a master's is $56,457.
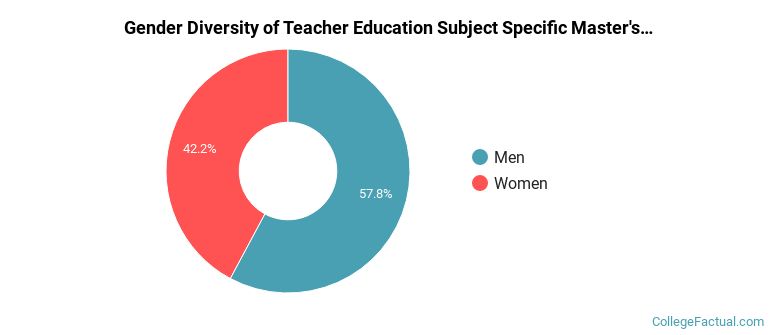
During the 2021-2022 academic year, 83 subject specific ed majors earned their master's degree from ESU. Of these graduates, 58% were men and 42% were women.
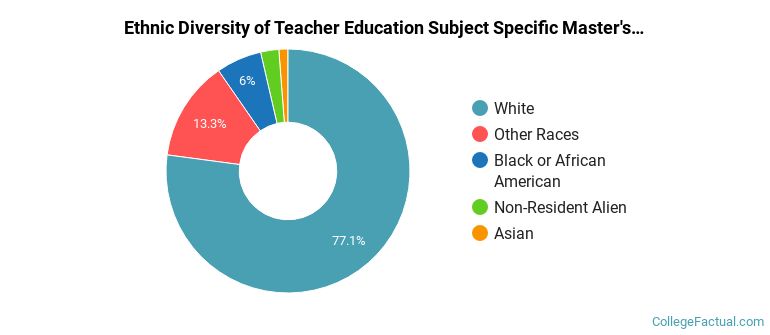
The majority of master's degree recipients in this major at ESU are white. In the most recent graduating class for which data is available, 77% of students fell into this category.
The following table and chart show the ethnic background for students who recently graduated from Emporia State University with a master's in subject specific ed.
| Ethnic Background | Number of Students |
|---|---|
| Asian | 1 |
| Black or African American | 5 |
| Hispanic or Latino | 0 |
| White | 64 |
| Non-Resident Aliens | 2 |
| Other Races | 11 |
Take a look at the following statistics related to the make-up of the subject specific ed majors at Emporia State University.
| Related Major | Annual Graduates |
|---|---|
| Curriculum & Instruction | 241 |
| Teacher Education Grade Specific | 209 |
| Educational Administration | 170 |
| Special Education | 67 |
| Student Counseling | 32 |
View All Teacher Education Subject Specific Related Majors >
More about our data sources and methodologies.