Explore the best ranked schools for the programs you are most interested in.
Franklin College of Indiana was not ranked in College Factual's 2025 Best Overall Colleges report. This could be for a number of reasons, including lack of data.
Because it has a high acceptance rate of 93%, some consider Franklin College of Indiana to be a safety school. But don't just assume that admittance is in the bag. Make sure to spend enough time on your application so that it is in tip-top shape.
About 46% of students accepted to Franklin College of Indiana submitted their SAT scores. When looking at the 25th through the 75th percentile, SAT Evidence-Based Reading and Writing scores ranged between 480 and 590. Math scores were between 490 and 580.
The student to faculty ratio at Franklin College of Indiana is an impressive 11 to 1. That's quite good when you compare it to the national average of 15 to 1. This is a good sign that students at the school will have more opportunities for one-on-one interactions with their professors.
When estimating how much access students will have to their teachers, some people like to look at what percentage of faculty members are full time. This is because part-time teachers may not have as much time to spend on campus as their full-time counterparts.
The full-time faculty percentage at Franklin College is 73%. This is higher than the national average of 47%.
The freshmen retention rate tells us what percentage of first-year, full-time students choose to continue on to their sophomore year at a particular school. The rate at Franklin College is 72%, which is about average when compared to the national rate of 68%.
The on-time graduation rate for someone pursuing a bachelor's degree is typically four years. This rate at Franklin College of Indiana for first-time, full-time students is 58%, which is better than the national average of 33.3%.
Find out more about the retention and graduation rates at Franklin College.
During the 2017-2018 academic year, there were 938 undergraduates at Franklin College of Indiana with 896 being full-time and 42 being part-time.
| $0-30 K | $30K-48K | $48-75 | $75-110K | $110K + |
|---|---|---|---|---|
| $19,791 | $17,751 | $20,733 | $24,018 | $12,864 |
The net price is calculated by adding tuition, room, board and other costs and subtracting financial aid.Note that the net price is typically less than the published for a school. For more information on the sticker price of Franklin College of Indiana, see our tuition and fees and room and board pages.
While almost two-thirds of students nationwide take out loans to pay for college, the percentage may be quite different for the school you plan on attending. At Franklin College of Indiana, approximately 82% of students took out student loans averaging $10,266 a year. That adds up to $41,064 over four years for those students.
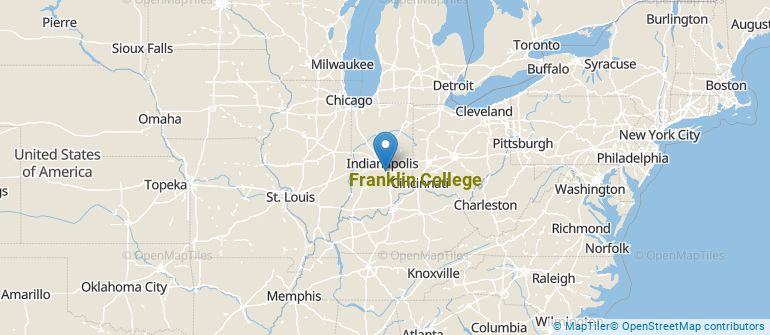
Get more details about the location of Franklin College.
Contact details for Franklin College of Indiana are given below.
| Contact Details | |
|---|---|
| Address: | 101 Branigin Blvd, Franklin, IN 46131-2623 |
| Phone: | 317-738-8000 |
| Website: | www.franklincollege.edu/ |
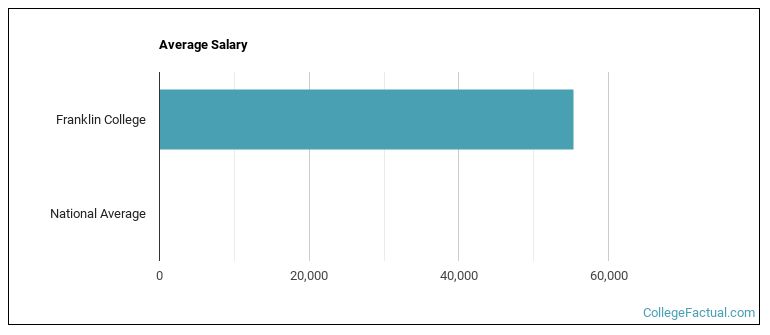
| Most Popular Majors | Bachelor’s Degrees | Average Salary of Graduates |
|---|---|---|
| Allied Health Professions | 31 | NA |
| Health & Physical Education | 21 | $24,181 |
| Business Administration & Management | 17 | $56,487 |
| General Psychology | 16 | $31,769 |
| General Biology | 14 | $30,969 |
| History | 12 | NA |
| Public Relations & Advertising | 11 | $36,964 |
| General Business/Commerce | 9 | NA |
| Teacher Education Grade Specific | 8 | $47,610 |
| Romance Languages | 8 | NA |
If you’re considering Franklin College, here are some more schools you may be interested in knowing more about.
Curious on how these schools stack up against Franklin College of Indiana? Pit them head to head with College Combat, our free interactive tool that lets you compare college on the features that matter most to you!
Footnotes
*The racial-ethnic minorities count is calculated by taking the total number of students and subtracting white students, international students, and students whose race/ethnicity was unknown. This number is then divided by the total number of students at the school to obtain the racial-ethnic minorities percentage.
References
More about our data sources and methodologies.