Criminology is a concentration offered under the criminology major at Lindenwood University. Here, you’ll find out more about the major master’s degree program in criminology, including such details as the number of graduates, diversity of students, and more.
If there’s something special you’re looking for, you can use one of the links below to find it:
Learn about start dates, transferring credits, availability of financial aid, and more by contacting the universities below.
Gain the management, leadership, data analysis and budgeting skills you need to advance in the criminal justice field with this online master's from Southern New Hampshire University.
In 2019-2020, the average part-time graduate tuition at Lindenwood University was $525 per credit hour for both in-state and out-of-state students. The following table shows the average full-time tuition and fees for graduate student.
| In State | Out of State | |
|---|---|---|
| Tuition | $9,450 | $9,450 |
| Fees | $100 | $100 |
If you’re one of the many students who want the flexibility of distance learning courses, you’ll be happy to hear that Lindenwood University offers online option in its criminology master’s degree program. To see if the school offers distance learning options in other areas, visit the Lindenwood University Online Learning page.
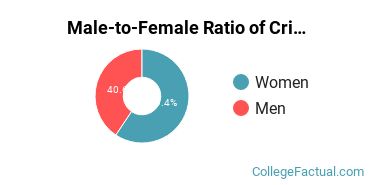
Women made up around 60.6% of the criminology students who took home a master’s degree in 2019-2020. This is less than the nationwide number of 65.4%.
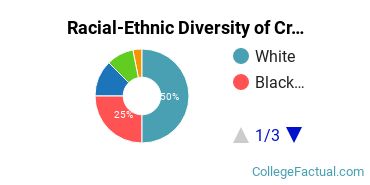
Of those graduates who received a master’s degree in criminology at Lindenwood University in 2019-2020, 48.5% were racial-ethnic minorities*. This is higher than the nationwide number of 35%.
| Race/Ethnicity | Number of Students |
|---|---|
| Asian | 0 |
| Black or African American | 14 |
| Hispanic or Latino | 2 |
| Native American or Alaska Native | 0 |
| Native Hawaiian or Pacific Islander | 0 |
| White | 14 |
| International Students | 0 |
| Other Races/Ethnicities | 3 |
*The racial-ethnic minorities count is calculated by taking the total number of students and subtracting white students, international students, and students whose race/ethnicity was unknown. This number is then divided by the total number of students at the school to obtain the racial-ethnic minorities percentage.
More about our data sources and methodologies.
