Here is an overview of this program at Fitchburg State. You can study it at the Bachelor’s level, with graduate study also available. Jump to any of the following sections:
College Factual rates Fitchburg State highly for special education, placing at #125 out of 463 schools nationally.Ranking Rank Best Special Education Schools 125 of 463 Best Special Education Schools in Massachusetts 9 of 19 Best Special Education Schools in the New England Region 11 of 34
The following degree levels are offered in special education at Fitchburg State, along with how many graduates complete each level annually.Degree Level Annual Graduates Bachelor’s 5 Master’s 76 Graduate Certificate 1
In the most recent year for which we have data, Fitchburg State University awarded 5 bachelor’s degrees in special education.
Fitchburg State is not yet ranked for special education at the bachelor’s level.
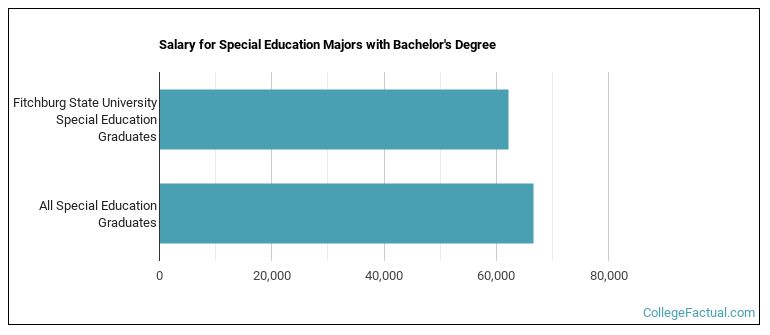
Special Education students who finish a bachelor’s at Fitchburg State go on to jobs where they make a median salary of $62,244 a year. This is lower than $66,598, the median for all majors at Fitchburg State.
Average full-time tuition and fees are listed in the table below.In State Out of State Tuition $970 $7,050 Fees $10,376 $10,376
Read more about Fitchburg State tuition and fees.
All of the 5 students who graduated with a bachelor’s degree in special education from Fitchburg State identified as women.
 The majority of special education bachelor’s degree graduates at Fitchburg State were White. Approximately 100% of graduates fell into this category.
The following table and chart show the ethnic background for students who recently graduated from Fitchburg State University with a bachelor’s in special education.

| Ethnic Background | Number of Students |
|---|---|
| Asian | 0 |
| Black or African American | 0 |
| Hispanic or Latino | 0 |
| White | 5 |
| Non-Resident Aliens | 0 |
| Other Races | 0 |
Fitchburg State awarded 5 bachelor’s degrees in special education and teaching, general in the most recent reporting year — 100% to women and 0% to men. The most common background among these graduates was White (100%).
Graduate study is also available at Fitchburg State. Here are the graduate award levels offered.Graduate Level Annual Graduates Master’s Degrees in Special Education 76 Graduate Certificate Degrees in Special Education 1