Explore the best ranked schools for the programs you are most interested in.
Hartwick was not ranked in College Factual's 2025 Best Overall Colleges report. This could be for a number of reasons, including lack of data.
The acceptance rate at Hartwick College is a competitive 60%, so make sure you take your application seriously when putting it together. Even leaving out a minor detail could be a reason to move you to the rejection pile.
About 15% of students accepted to Hartwick submitted their SAT scores. When looking at the 25th through the 75th percentile, SAT Evidence-Based Reading and Writing scores ranged between 520 and 620. Math scores were between 500 and 590.
The student to faculty ratio is often used to measure the number of teaching resources that a college or university offers its students. The national average for this metric is 15 to 1, but at Hartwick it is much better at 10 to 1. That's good news for students who want to interact more on a personal level with their teachers.
When estimating how much access students will have to their teachers, some people like to look at what percentage of faculty members are full time. This is because part-time teachers may not have as much time to spend on campus as their full-time counterparts.
The full-time faculty percentage at Hartwick College is 100%. This is higher than the national average of 47%.
The freshmen retention rate tells us what percentage of first-year, full-time students choose to continue on to their sophomore year at a particular school. The rate at Hartwick College is 69%, which is about average when compared to the national rate of 68%.
The on-time graduation rate for someone pursuing a bachelor's degree is typically four years. This rate at Hartwick for first-time, full-time students is 54%, which is better than the national average of 33.3%.
Find out more about the retention and graduation rates at Hartwick College.
During the 2017-2018 academic year, there were 1,207 undergraduates at Hartwick with 1,190 being full-time and 17 being part-time.
| $0-30 K | $30K-48K | $48-75 | $75-110K | $110K + |
|---|---|---|---|---|
| $20,997 | $22,349 | $22,428 | $22,139 | $25,306 |
The net price is calculated by adding tuition, room, board and other costs and subtracting financial aid.Note that the net price is typically less than the published for a school. For more information on the sticker price of Hartwick, see our tuition and fees and room and board pages.
While almost two-thirds of students nationwide take out loans to pay for college, the percentage may be quite different for the school you plan on attending. At Hartwick, approximately 91% of students took out student loans averaging $7,740 a year. That adds up to $30,960 over four years for those students.
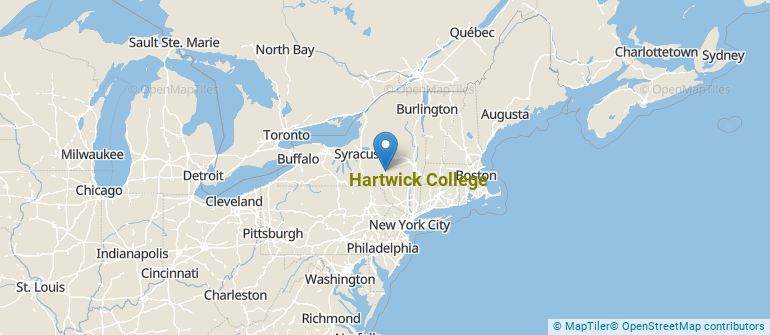
Get more details about the location of Hartwick College.
Contact details for Hartwick are given below.
| Contact Details | |
|---|---|
| Address: | One Hartwick Drive, Oneonta, NY 13820-4020 |
| Phone: | 607-431-4000 |
| Website: | www.hartwick.edu/ |
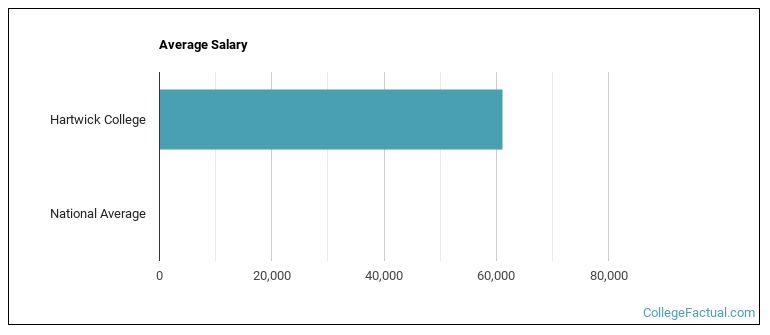
| Most Popular Majors | Bachelor’s Degrees | Average Salary of Graduates |
|---|---|---|
| Nursing | 42 | NA |
| Business Administration & Management | 26 | $48,111 |
| Public Health | 22 | NA |
| Criminal Justice & Corrections | 17 | NA |
| General Psychology | 14 | NA |
| General Biology | 12 | $38,467 |
| Political Science & Government | 10 | $36,606 |
| Sociology | 10 | NA |
| History | 9 | NA |
| Fine & Studio Arts | 9 | NA |
Online courses area a great option for busy, working students as well as for those who have scheduling conflicts and want to study on their own time. As time goes by, expect to see more and more online learning options become available.
In 2022-2023, 186 students took at least one online class at Hartwick College. This is a decrease from the 324 students who took online classes the previous year.
| Year | Took at Least One Online Class | Took All Classes Online |
|---|---|---|
| 2022-2023 | 186 | 4 |
| 2021-2022 | 324 | 7 |
| 2020-2021 | 1,207 | 2 |
| 2018-2019 | 34 | 0 |
If you’re considering Hartwick College, here are some more schools you may be interested in knowing more about.
Curious on how these schools stack up against Hartwick? Pit them head to head with College Combat, our free interactive tool that lets you compare college on the features that matter most to you!
Footnotes
*The racial-ethnic minorities count is calculated by taking the total number of students and subtracting white students, international students, and students whose race/ethnicity was unknown. This number is then divided by the total number of students at the school to obtain the racial-ethnic minorities percentage.
References
More about our data sources and methodologies.